The U.S. government does not track death rates for every drug. However, the National Center for Health Statistics at the Centers for Disease Control and Prevention does collect information on many of the more commonly used drugs. The CDC also has a searchable database, called CDC Wonder.
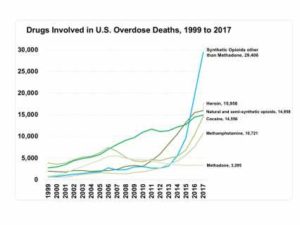
Drugs Involved in U.S. Overdose Deaths* – Among the more than 72,000 drug overdose deaths estimated in 2017*, the sharpest increase occurred among deaths related to fentanyl and fentanyl analogs (synthetic opioids) with nearly 30,000 overdose deaths. Source: CDC WONDER
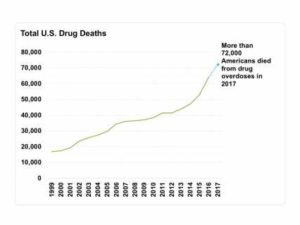
Total U.S. Drug Deaths* – More than 72,000 Americans died from drug overdoses in 2017, including illicit drugs and prescription opioids—a 2-fold increase in a decade. Source: CDC WONDER
* Provisional counts for 2017 are based on data available through 12/17 but are not yet finalized. Counts through 2016 are based on final annual data.
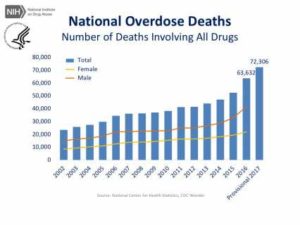
National Overdose Deaths—Number of Deaths Involving All Drugs. The figure above is a bar chart showing the total number of U.S. overdose deaths involving all drugs from 2002 to 2016 and provisional 2017 data. The chart is overlayed by a line graph showing the number of deaths of females and males from 2002 to 2016. From 2002 to 2017 there was a 3.1-fold increase in the total number of deaths.
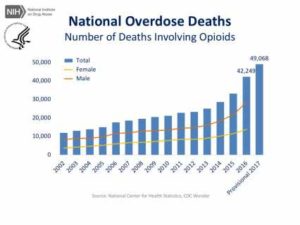
National Overdose Deaths—Number of Deaths Involving Opioid Drugs. The figure above is a bar chart showing the total number of U.S. overdose deaths involving opioid drugs from 2002 to 2016 and provisional 2017 data. Included in this number are opioid analgesics, along with heroin and illicit synthetic opioids. The chart is overlayed by a line graph showing the number of deaths of females and males from 2002 to 2016. From 2002-2017 there was a 4.1-fold increase in the total number of deaths.
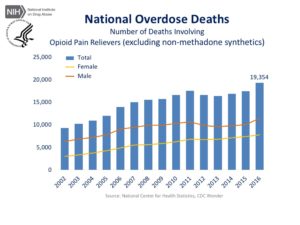
National Overdose Deaths—Number of Deaths Involving Prescription Opioid Pain Relievers (excluding non-methadone synthetics). The figure above is a bar chart showing the total number of U.S. overdose deaths involving opioid pain relievers (excluding non-methadone synthetics) from 2002 to 2016. Non-methadone synthetics is a category dominated by illicit fentanyl, and has been excluded to more accurately reflect deaths from prescription opioids. The chart is overlayed by a line graph showing the number of deaths of females and males. From 2002 to 2011 there was a 1.9-fold increase in the total number of deaths, but it has remained relatively stable since then.
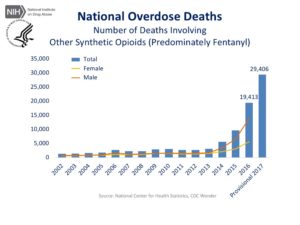
National Overdose Deaths—Number of Deaths Involving Other Synthetic Opioids (Predominately Fentanyl). The figure above is a bar chart showing the total number of U.S. overdose deaths involving other synthetic opioids from 2002 to 2016 and provisional 2017 data. Other synthetic opioids is a category dominated by illicit fentanyl. The chart is overlayed by a line graph showing the number of deaths of females and males. From 2002 to 2017 there was a 22-fold increase in the total number of deaths.
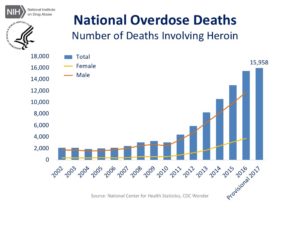
National Overdose Deaths—Number of Deaths Involving Heroin. The figure above is a bar chart showing the total number of U.S. overdose deaths involving heroin from 2002 to 2016 and provisional 2017 data. The chart is overlayed by a line graph showing the number of deaths of females and males from 2002 to 2016. From 2002 through 2017, there was a 7.6-fold increase in the total number of deaths.
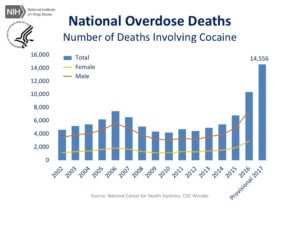
National Overdose Deaths—Number of Deaths Involving Cocaine. The figure above is a bar chart showing the total number of U.S. overdose deaths involving cocaine from 2002 to 2016 and provisional 2017 data. The chart is overlayed by a line graph showing the number of deaths of females and males from 2002 to 2016. From the lowest number in 2010 to 2017, there has been a 3.5-fold increase in the total number of deaths.
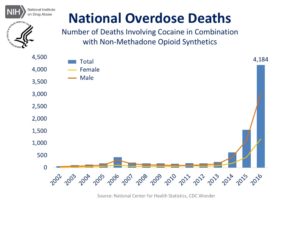
National Overdose Deaths—Number of Deaths Involving Cocaine in Combination with Non-Methadone Opioid Synthetics. The figure above is a bar chart showing the total number of U.S. overdose deaths involving cocaine in combination with other synthetic opioids, dominated by illicit fentanyl. From 2002 to 2016 there was little increase in overall deaths but from 2012 through 2016 there was a 23-fold increase in the total number of deaths. The chart is overlayed by a line graph showing the number of deaths of females and males from 2002 to 2016.
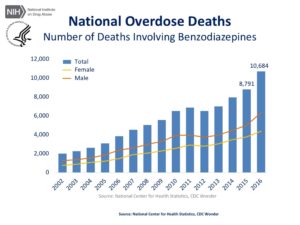
National Overdose Deaths—Number of Deaths Involving Benzodiazepines. The figure above is a bar chart showing the total number of U.S. overdose deaths involving benzodiazepines from 2002 to 2016. The chart is overlayed by a line graph showing the number of deaths of females and males. From 2002 to 2016 there was a 8-fold increase in the total number of deaths.
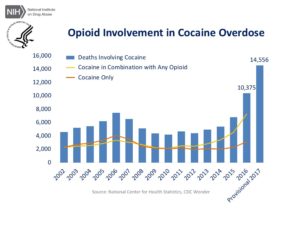
National Overdose Deaths—Number of Deaths Involving Cocaine, with and without opioids. The figure above is a bar chart showing the total number of U.S. overdose deaths involving cocaine from 2002 to 2016 and provisional 2017 data, with the yellow line representing the number of cocaine deaths that also involved opioids, and the orange line representing cocaine deaths that did not involve opioids. These categories were equal in 2010. Since then, deaths involving both cocaine and opioids have more than tripled, while cocaine deaths not involving opioids have increased by 1.5-fold.
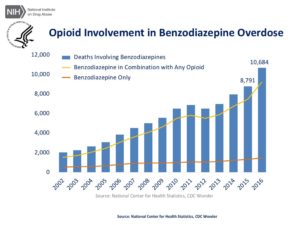
National Overdose Deaths—Number of Deaths Involving Benzodiazepines, with and without opioids. The benzodiazepines from 2002 to 2016, with the yellow line representing the number of benzodiazepine deaths that also involved opioids, and the orange line representing benzodiazepine deaths that did not involve opioids. From 2002-2016, benzodiazepine deaths involving opioids increased six-fold more than those not involving opioids.
The figures above are bar charts showing the number of U.S. overdose deaths involving all drugs, opioid drugs, opioid analgesics (excluding non-methadone synthetic, the category dominated by illicit fentanyl), heroin, heroin and non-methadone synthetics (to capture illicit opioids), benzodiazepines, or cocaine from 2002 to 2016 (provisional 2017 data available for select drugs). The charts are overlayed by line graphs showing the number of deaths by males and females. The highest rise was seen for deaths involving other synthetic opioids, with a 22-fold increase from 2002 to 2017. The final two charts show the numbers of cocaine and benzodiazepine deaths that also involved an opioid; overdoses on these drug combinations have increased by nearly 3- and 6- fold respectively. These categories are not mutually exclusive and therefore cannot be summed.
This page was last updated August 2018
Source: https://www.drugabuse.gov/related-topics/trends-statistics/overdose-death-rates